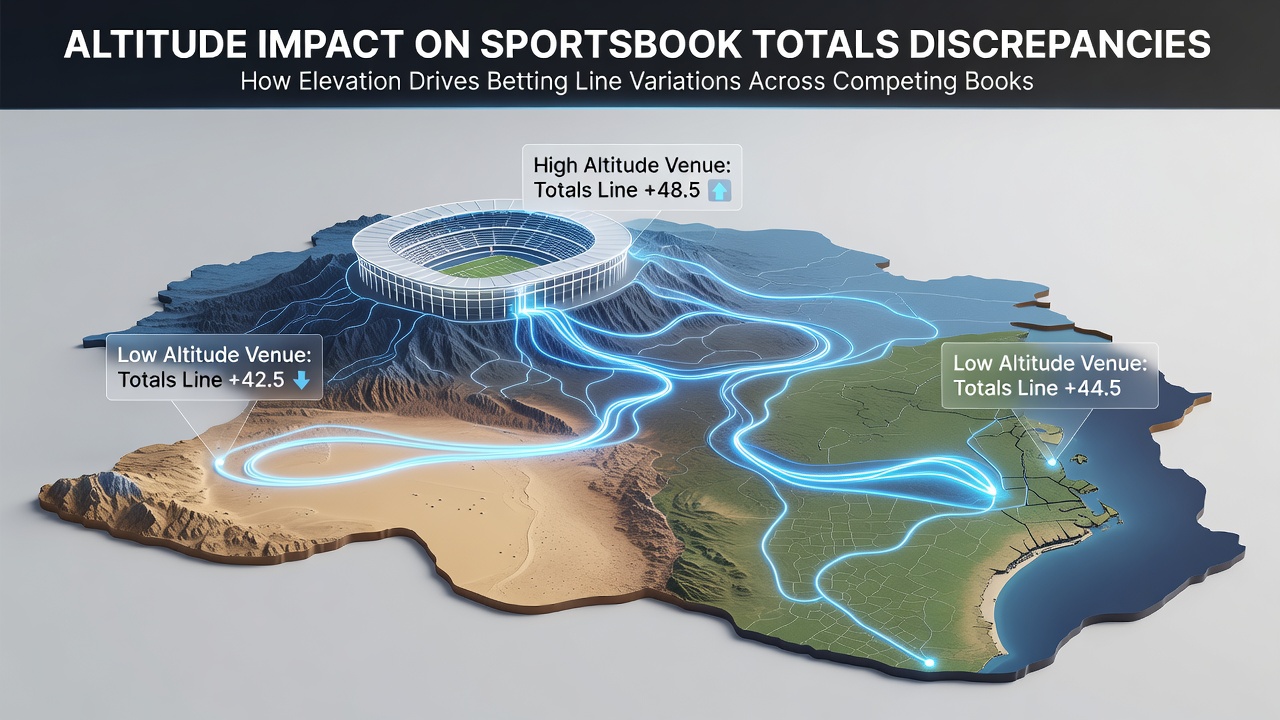
Altitude Variations in Sports Venues Shape Totals Line Differences Across Sportsbooks
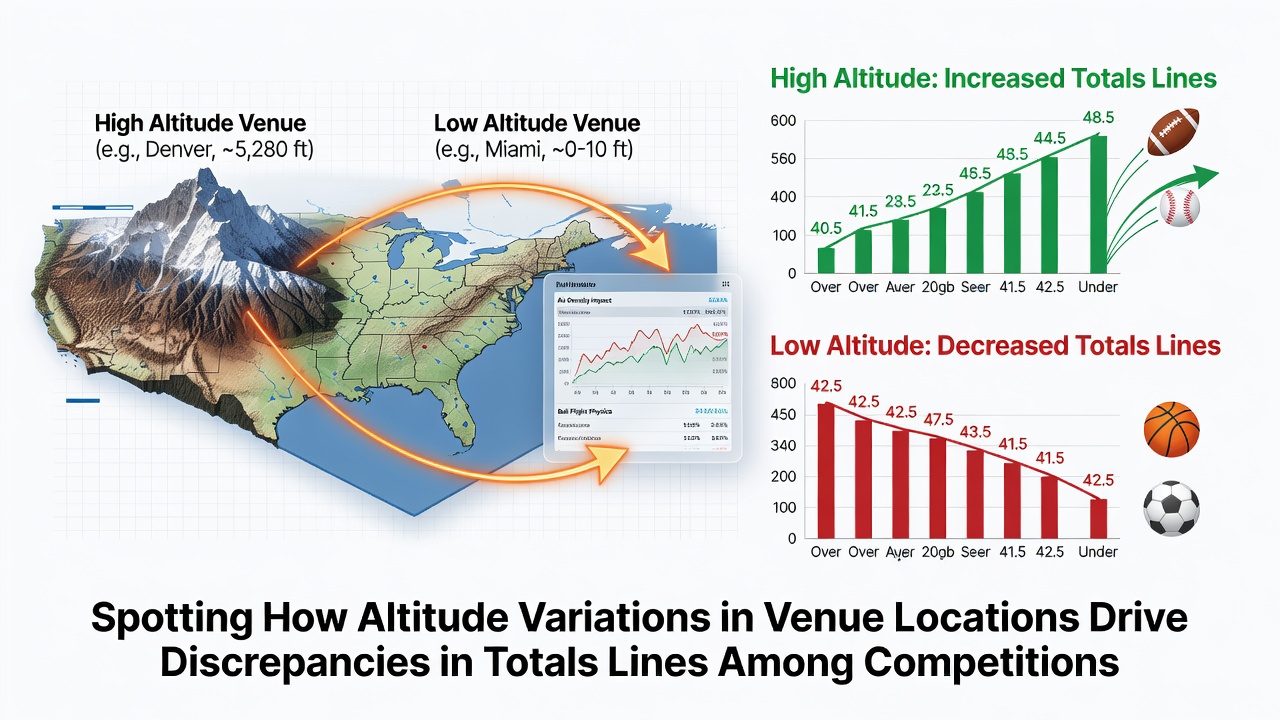
Venues at different elevations alter how balls travel through thinner air, and competing sportsbooks apply distinct modeling approaches that produce noticeable gaps in totals lines for the same events. Researchers at institutions like the University of Colorado have documented how reduced air density at elevations above 5,000 feet allows baseballs and footballs to carry farther, which increases scoring potential in affected games. Data from Major League Baseball shows that Coors Field in Denver sits at 5,280 feet and consistently yields higher run totals than sea-level parks such as those in Miami or San Diego.
Physical Effects of Elevation on Game Play
Lower air resistance at high altitude changes projectile paths in measurable ways, and physicists note that a baseball hit at 5,280 feet travels roughly 10 percent farther than an identical hit at sea level. This pattern appears in both baseball and American football, where kick distances and passing ranges extend, yet defensive reactions remain unchanged because player speed does not increase proportionally. Observers note that basketball games played at altitude experience less pronounced effects because the ball travels shorter distances overall, yet fatigue from reduced oxygen can still influence fourth-quarter scoring.
How Sportsbooks Adjust Totals Lines
Operators incorporate elevation data into proprietary algorithms that weigh historical scoring rates at each venue, yet the weight assigned to altitude varies between platforms. One book might add 0.8 runs to an expected baseball total for a game at Coors Field while another adds 1.2 runs based on different sample sizes or weather integration methods. These modeling differences create line discrepancies that bettors can identify by comparing totals across multiple operators for the same matchup. Figures from the 2025 MLB season reveal that average run totals at Coors Field reached 11.4 per game while the league-wide average sat at 9.1, and platforms updated their lines at different speeds when new weather or roster data arrived.
Examples from Professional Leagues
Take the Colorado Rockies hosting the Los Angeles Dodgers at Coors Field, where one sportsbook opened the total at 10.5 runs and another listed 11.5 runs for the identical game. The gap stemmed from divergent historical datasets that either included or excluded games played during specific humidity conditions common in July. Similar patterns occur in the NFL when the Denver Broncos host opponents at Empower Field at Mile High, where totals lines for passing yards and combined points often differ by two or three points across major operators. Analysts at the NCAA have tracked parallel effects in college football games played at elevated sites such as Laramie, Wyoming, or Albuquerque, New Mexico, where totals lines shift by larger margins because fewer data points exist for those venues.
Tracking Line Movements Over Time
Line discrepancies widen when one operator updates its model faster after receiving new forecast data, and bettors monitor these shifts by refreshing multiple platforms simultaneously. In July 2026, early-season MLB games at elevated venues produced totals line spreads of up to 1.5 runs between leading operators because some books adjusted for summer heat while others focused solely on elevation. Cross-site comparisons become easier when users track opening lines versus closing lines, because the rate of adjustment reveals how each platform values altitude relative to other variables such as pitcher handedness or recent travel schedules.
Data Sources and Research Integration
Studies published through the University of Colorado integrate ball-flight simulations with actual game logs to refine elevation adjustments, while reports from NCAA research initiatives examine how altitude interacts with player acclimatization across multiple sports. These sources supply operators with baseline data that each platform then modifies according to its own risk parameters and historical payout records. The resulting line differences remain visible to users who compare totals across at least three operators before placing wagers on games at elevated sites.
Conclusion
Altitude variations at specific venues create systematic scoring shifts that sportsbooks translate into totals lines using different computational weights, and these modeling choices produce persistent discrepancies across platforms. Observers who compare lines for games at Coors Field, Mile High, or other high-elevation sites can identify the gaps that arise when one operator emphasizes historical run rates while another prioritizes current weather inputs. Continued collection of venue-specific data through academic and league sources supports more precise adjustments over time, yet differences between operators persist because each platform maintains distinct risk models and update frequencies.